 1
 2
 3
 4
 5
 6
 7
 8
 9
10
11
12
13
14
15
16
17
18
19
20
21
22
23
24
25
26
27
28
29
30
31
32
33
34
35
36
37
38
39
40
41
42
43
44
45
46
47
48
49
50
51
52
53
54
55
56
57
58
59
60
61
62
63
64
65
66
67
68
69
70
71
72
73
74
75
76
77
78
79
80
81
82
83
84
85
86
87
88
89
90
91
92
93
94
95
96
97
98
99
100
101
102
103
104
105
106
107
108
109
110
111
112
113
114
115
116
117
118
119
120
121
122
123
124
125
126
127
128
129
130
131
132
133
134
135
136
137
138
139
140
141
142
143
144
145
146
147
148
149
150
151
152
153
154
155
156
157
158
159
| void CmfcplotView::OnDraw(CDC* pDC)
{
CmfcplotDoc* pDoc = GetDocument();
ASSERT_VALID(pDoc);
if (!pDoc)
return;
m_Xmin = pDoc->m_Xmin;//极值保存在Doc中
m_Xmax = pDoc->m_Xmax;
m_Ymin = pDoc->m_Ymin;
m_Ymax = pDoc->m_Ymax;
CRect rect;
GetClientRect(&rect);//获得视图区
nTop = (int)round(rect.bottom * 0.1); //函数图像不会占据整个视图区
nButton = (int)round(rect.bottom * 0.9);
nLeft = (int)round(rect.right * 0.1);
nRight = (int)round(rect.right * 0.9);
if (pDoc->m_WillShowEdge) {//画边框
pDC->MoveTo(nLeft, nTop);
pDC->LineTo(nLeft, nButton);
pDC->LineTo(nRight, nButton);
pDC->LineTo(nRight, nTop);
pDC->LineTo(nLeft, nTop);
}
//画x坐标信息
int nX,nY;
bool BIGX = abs(m_Xmin) > 100 || abs(m_Xmax) > 100;//x坐标值比较大时,标注更稀
for (nX = nLeft; nX < nRight; nX += (BIGX ? 100 : 50)) { //每隔100/50像素一个标注
CRect textRect(nX - (BIGX ? 50 : 25), nButton + 1, nX + (BIGX ? 50 : 25), nButton + 20);//显示区域
CString xInfo;
xInfo.Format(_T("%.2f"),LPxtoFPx(nX));
pDC->DrawText(xInfo, &textRect, DT_SINGLELINE | DT_CENTER);
//单行,上下左右居中显示
}
if (nX - nRight <= (BIGX ? 50 : 25)) {//最后一个x坐标,与前一个标注距离太近则不显示
CRect textRect(nRight, nButton + 1, nRight + 50, nButton + 20);
CString xInfo;
xInfo.Format(_T("%.2f"),m_Xmax);
pDC->DrawText(xInfo, &textRect, DT_SINGLELINE | DT_LEFT | DT_TOP);
}
//y坐标
for (nY = nButton - 50; nY > nTop; nY -= 50) {
CRect textRect(nLeft - 200, nY-10, nLeft - 3, nY + 10);
CString yInfo;
yInfo.Format(_T("%.2f"), LPytoFPy(nY));
pDC->DrawText(yInfo, &textRect, DT_SINGLELINE | DT_RIGHT);
}
if (nTop - nY <= 25) {
CRect textRect(nLeft - 200, nTop - 10, nLeft - 3, nTop + 10);
CString yInfo;
yInfo.Format(_T("%.2f"),m_Ymax);
pDC->DrawText(yInfo, &textRect, DT_SINGLELINE | DT_BOTTOM | DT_RIGHT);
}
// 显示网格
if (pDoc->m_WillShowGrid) {
CPen pen(PS_DOT, 1, RGB(100, 100, 100)); //创建笔,虚线,并调整坐标颜色灰色
CPen *pOldPen = (CPen *)pDC->SelectObject(&pen);
for (nX = nLeft+50; nX < nRight; nX += 50) {
pDC->MoveTo(nX, nTop);
pDC->LineTo(nX, nButton);
}
for (nY = nButton - 50; nY > nTop; nY -= 50) {
pDC->MoveTo(nLeft, nY);
pDC->LineTo(nRight, nY);
}
pDC->SelectObject(pOldPen);
}
// 显示坐标轴
if (pDoc->m_WillShowAxis) {
CPen pen(PS_SOLID, 2, RGB(0, 0, 0));
CPen* pOldPen = (CPen*)pDC->SelectObject(&pen);
int oX = FPxtoLPx(0);
int oY = FPytoLPy(0);
bool showY = oX >= nLeft && oX <= nRight;
bool showX = oY >= nTop && oY <= nButton;//判断x,y轴是否在范围内
if (showX) {
pDC->MoveTo(nLeft - 10, oY);
pDC->LineTo(nRight + 10, oY);
}
if (showY) {
pDC->MoveTo(oX, nButton + 10);
pDC->LineTo(oX, nTop - 10);
}
if (showX && showY) {
pDC->TextOutW(oX + 1, oY + 1, _T("O"));
}
if (showX) {
pDC->MoveTo(nRight + 10, oY);
pDC->LineTo(nRight + 5, oY + 5);
pDC->MoveTo(nRight + 10, oY);
pDC->LineTo(nRight + 5, oY - 5);
pDC->TextOutW(nRight + 10, oY, _T("X轴"));
}
if (showY) {
pDC->MoveTo(oX, nTop - 10);
pDC->LineTo(oX - 5, nTop - 5);
pDC->MoveTo(oX, nTop - 10);
pDC->LineTo(oX + 5, nTop - 5);
pDC->TextOutW(oX + 5, nTop - 10, _T("Y轴"));
}
pDC->SelectObject(pOldPen);
}
POSITION p = pDoc->m_List.GetHeadPosition();
int showTop = nTop;
while (p != nullptr) {
bool shouldMov = true;//一段曲线第一个点MoveTo,其他都是LineTo
FuncData* tmpFD = (FuncData*)pDoc->m_List.GetNext(p);
CPen pen(tmpFD->m_penType, tmpFD->m_penWidth, tmpFD->m_color);
CPen* pOldPen = (CPen*)pDC->SelectObject(&pen);
if (tmpFD->FuncCas == CAS_NORMAL) {//动态X坐标模式下,普通函数x范围与视图不同时自动同步
if (pDoc->m_ForceXrange && isMoving!=2)
if (tmpFD->minX != m_Xmin || tmpFD->maxX != m_Xmax) {
tmpFD->minX = m_Xmin;
tmpFD->maxX = m_Xmax;
tmpFD->CalcList();
}
}
for (auto dot : tmpFD->vetPoint) {
if (dot.first < m_Xmin || dot.first > m_Xmax || dot.second < m_Ymin || dot.second > m_Ymax || dot.second != dot.second) {
shouldMov = true;
continue;
}
if (shouldMov) {
pDC->MoveTo(FPxtoLPx(dot.first), FPytoLPy(dot.second));
shouldMov = false;
}
else
pDC->LineTo(FPxtoLPx(dot.first), FPytoLPy(dot.second));
}
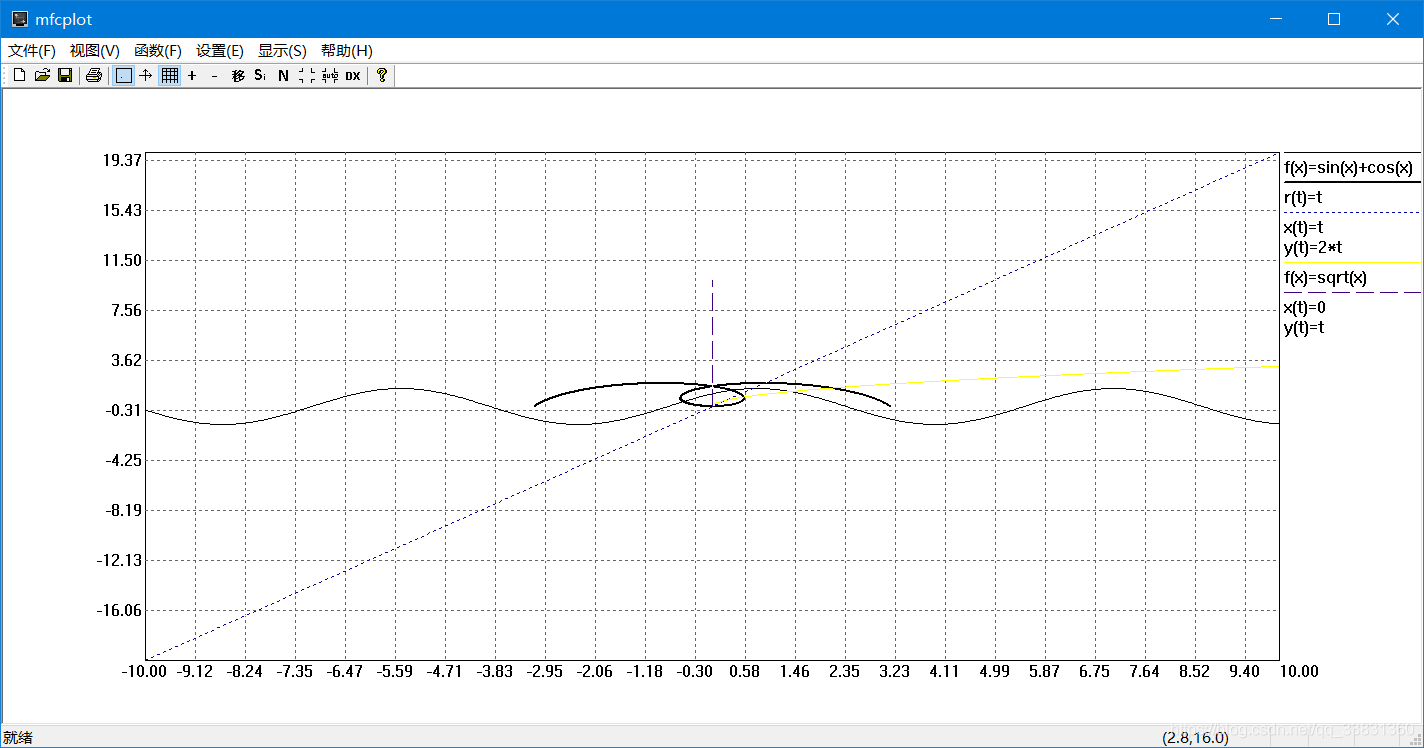
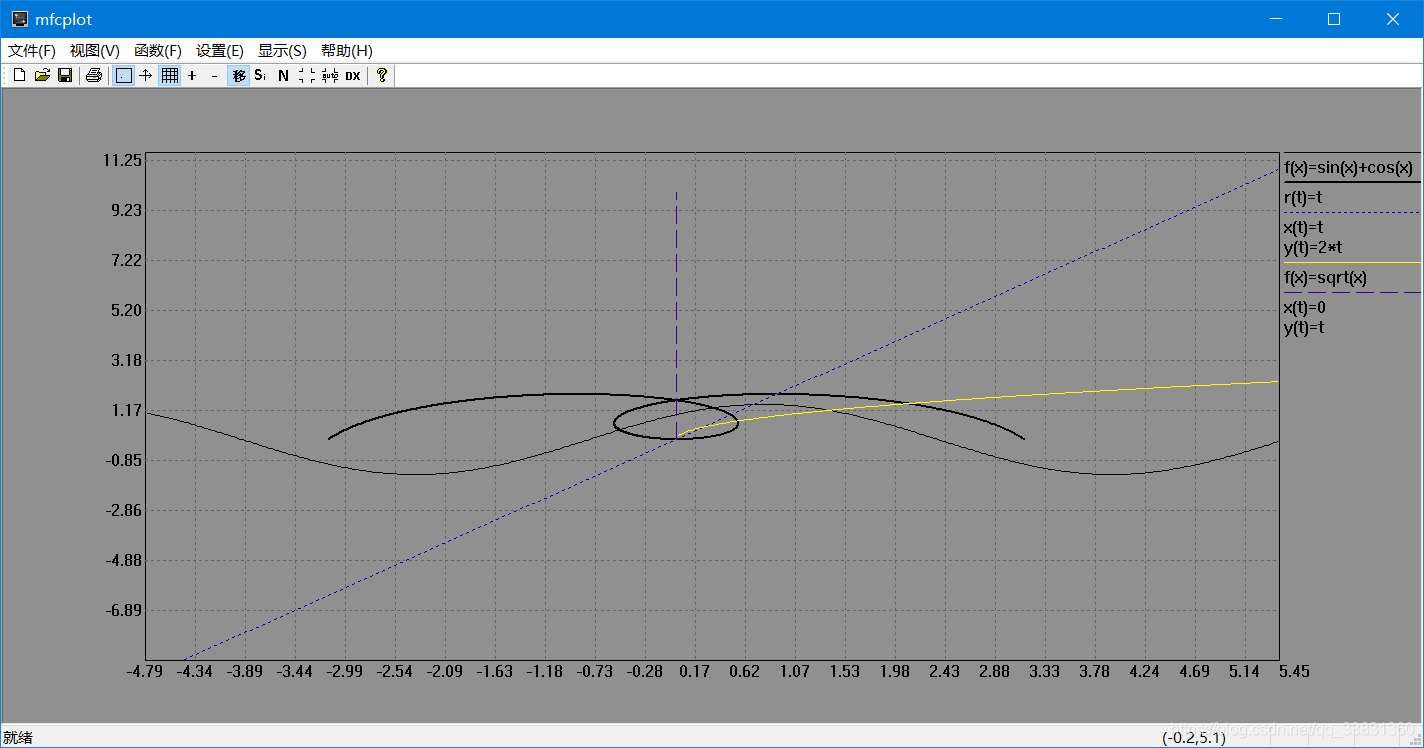
pDC->MoveTo(nRight+5, showTop);//显示图例
pDC->LineTo(rect.right, showTop);
showTop += 5;
if (tmpFD->FuncCas == CAS_NORMAL)
pDC->TextOutW(nRight + 5, showTop, _T("f(x)=")+tmpFD->m_Equation);
else if (tmpFD->FuncCas == CAS_POLAR)
pDC->TextOutW(nRight + 5, showTop, _T("r(t)=") + tmpFD->m_Equation);
else if (tmpFD->FuncCas == CAS_TWO) {
pDC->TextOutW(nRight + 5, showTop, _T("x(t)=") + tmpFD->m_Equation);
showTop += 20;
pDC->TextOutW(nRight + 5, showTop, _T("y(t)=") + tmpFD->GetEquation2());
} else if (tmpFD->FuncCas == CAS_DATA)
pDC->TextOutW(nRight + 5, showTop, _T("y(t)=") + tmpFD->m_Equation);
showTop += 25;
pDC->SelectObject(pOldPen);
}
}
|